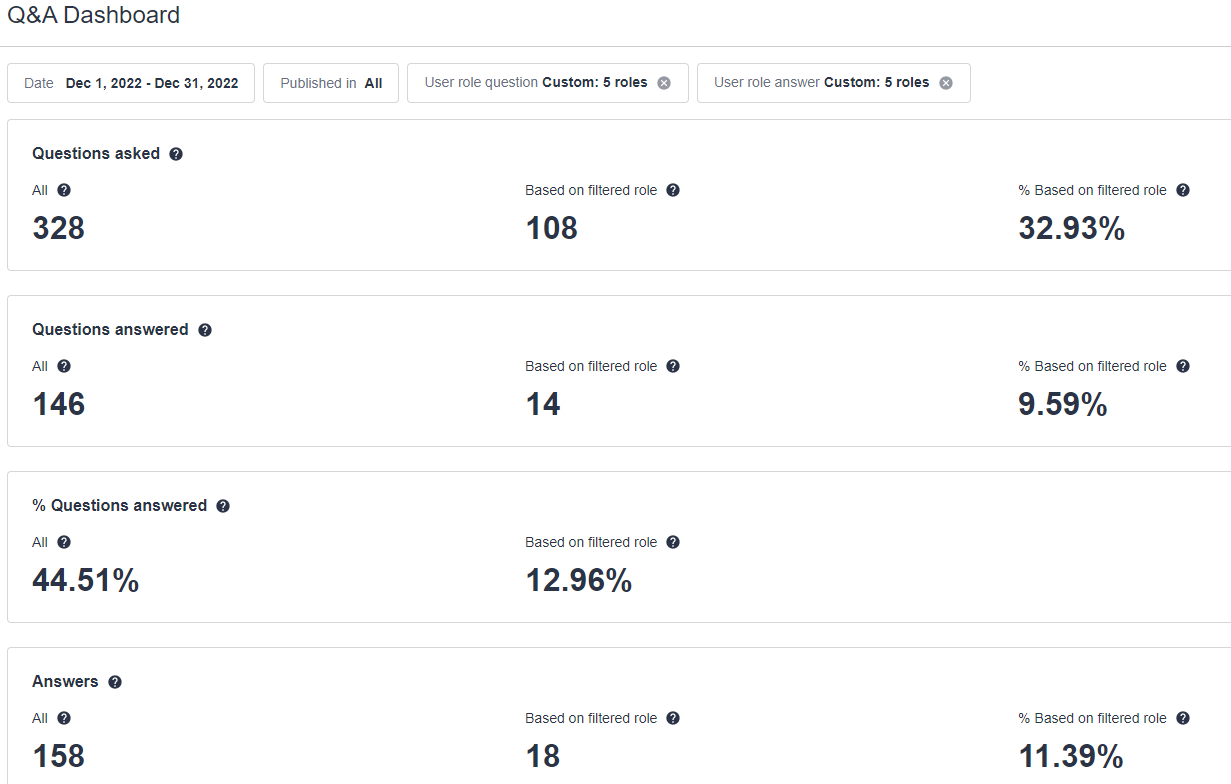
The updated Q&A Dashboard, formally known as the Success Dashboard, now focuses solely on the Community/Q&A module. This ensures that the most relevant Q&A metrics are surfaced in the same dashboard providing a clear picture of community/Q&A engagement.
With this dashboard, you can see the number of questions asked and answered, the number of answers given by different roles, and the average answer time. Leverage filtering capabilities to hone in on specific datasets based on user role.
Let’s dive into how each metric is shown on the Q&A Dashboard behaves. First, there are a few basic principles to keep in mind:
-
In general, the dashboards reflect the current state of the community, rather than ‘what happened at the time.’
-
That means that current & historical data will change to reflect the current state after you carry out moderation actions like trashing a topic, moving a reply, or changing the category of a topic.
-
Spam/trashed/deleted topics are not taken into account in the content metrics.
-
Percentage difference calculations are calculated as follows: ((A - B)/A)*100
There are 3 sections in the Dashboard:
-
Questions
-
Answers
-
Average answer time
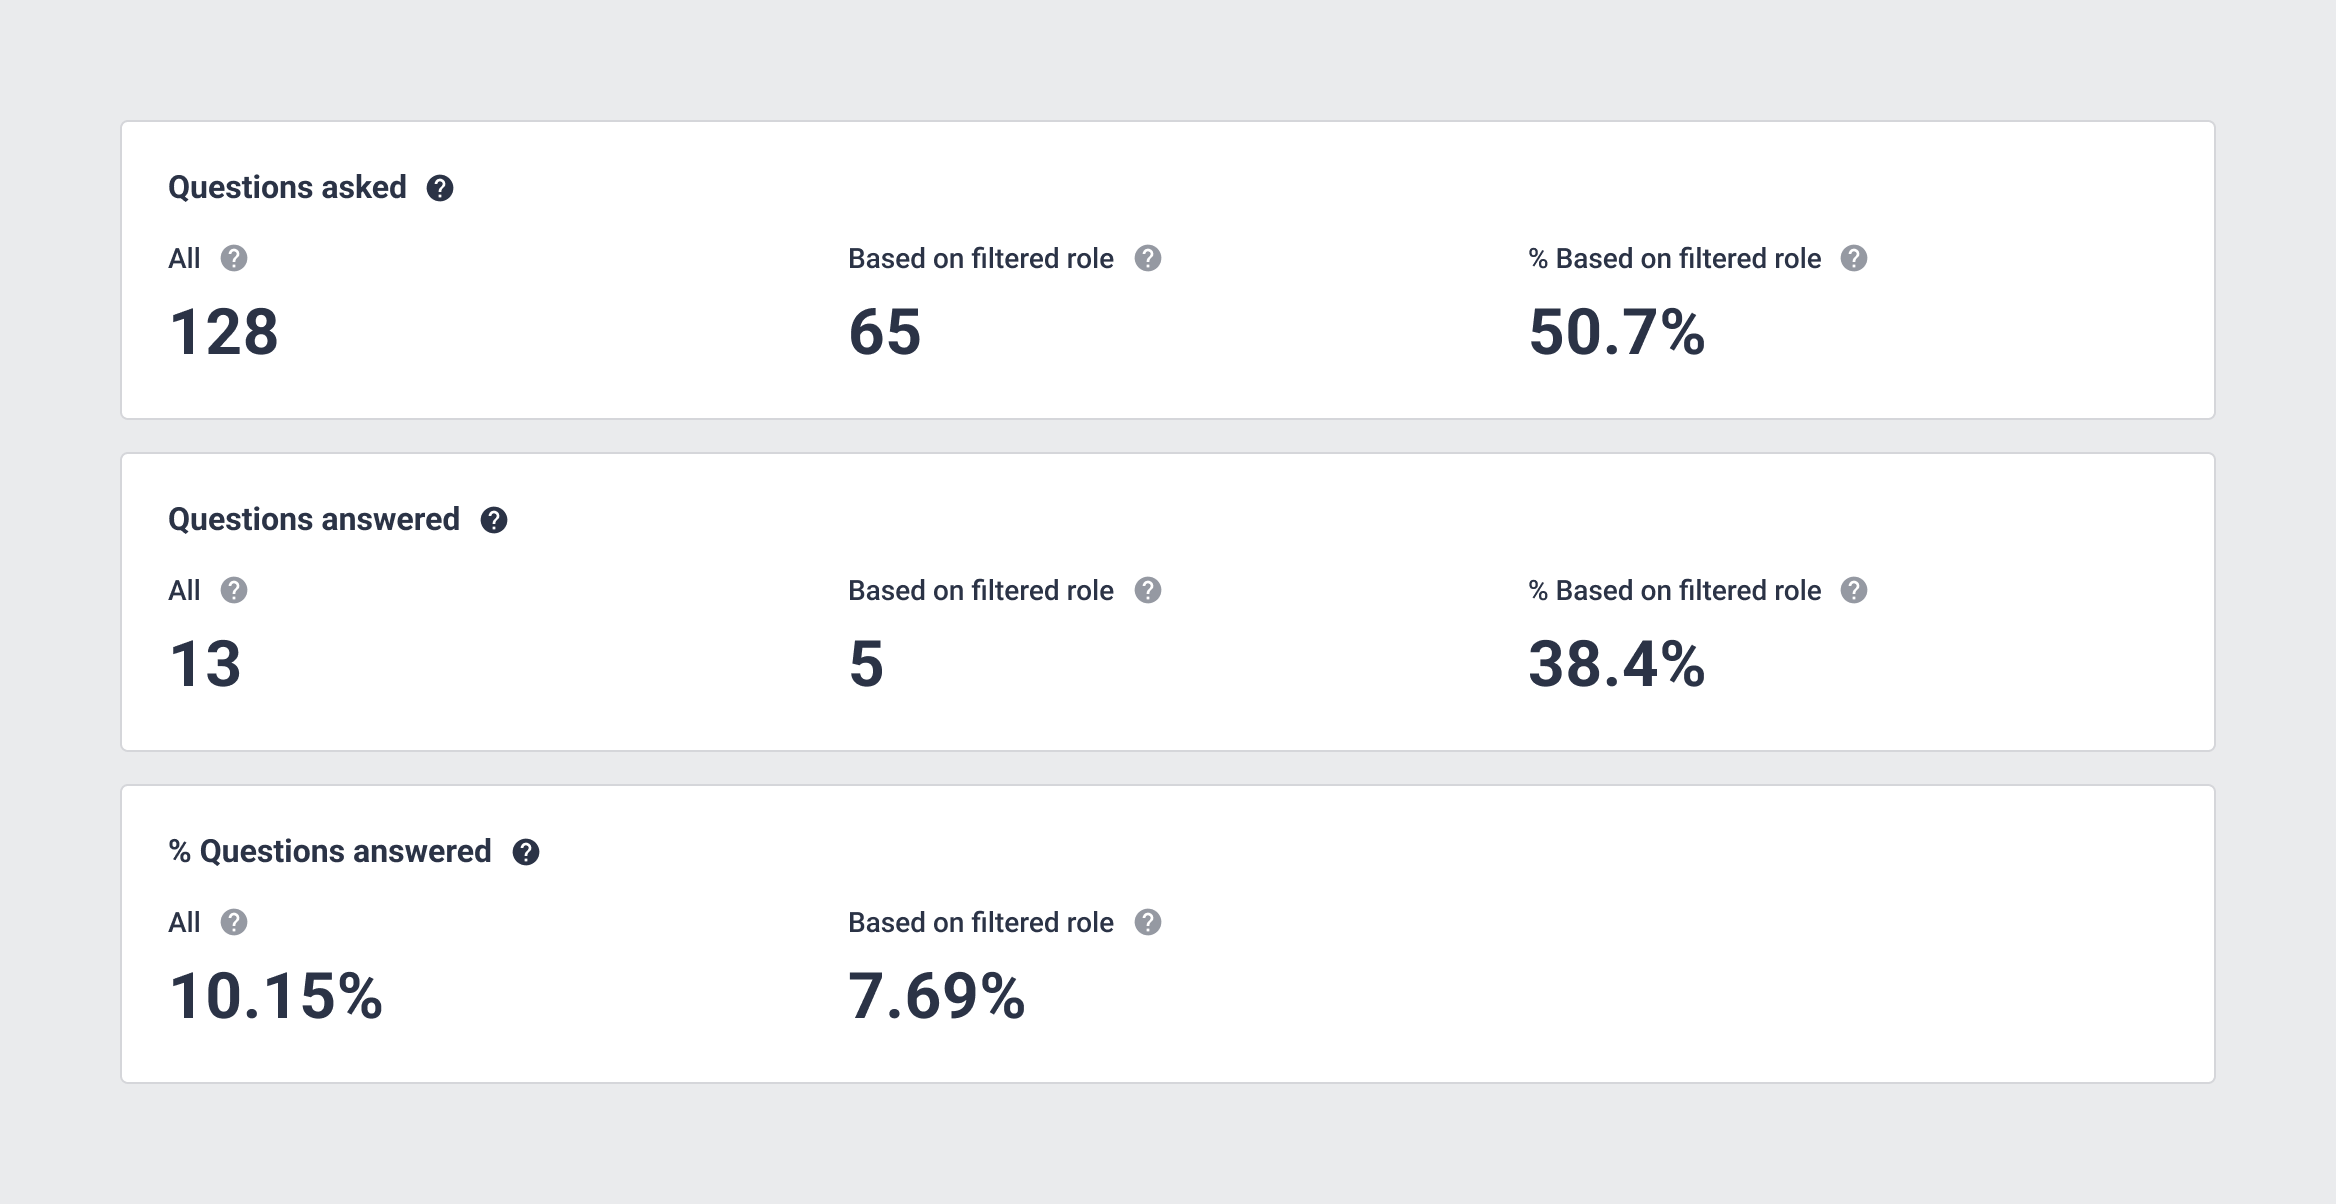
Questions
In the section, we look at the Questions asked in a given period of time and we track what happened to them in time. We also track Questions answered to see if those questions were answered. We don’t look at the time when an answer was given, so as more time passes from when the question was asked the probability that it is answered will increase.
For example, looking back on the questions asked 6 months ago, it is a high probability that all of them were answered. If you look back on the questions asked last month, you may find that some of them are still not answered.
| # All Questions asked | # Question asked Based on filtered role | % Question asked Based on filtered role |
| The number of all questions asked in the selected time period | The number of questions asked in the selected time period by users with specific roles selected in User role question filter. | Percentage of questions asked by selected roles (User role question) in a selected time period among all questions asked in that time. Formula: Questions asked based on filtered role / All Questions asked * 100 |
| # All Questions answered | # Question answered Based on filtered role | % Question answered Based on filtered role |
| The number of all questions asked in the selected time period that also have an answer marked. | The number of questions asked by users with specific roles selected in User role question filter in a selected time period that also have an answer marked and the answer was provided by the user with roles selected in User role answer filter | Percentage of questions asked by selected roles (User role question) in a selected time period that were answered by users with a selected role (User role answer) among all questions asked in that time that have an answer marked. Formula: Formula: Questions answered based on filtered role /All Questions answered * 100 |
| % All Questions answered | % Question answered Based on filtered role |
| Percentage of all questions asked in the selected time period that also have an answer marked
Formula: All Questions answered / All Questions asked * 100 | Percentage of questions asked by users with selected role (User role question) that were answered by users with a selected role (User role answer) among questions asked by users with the roles selected in User role question in that time period. Formula: Questions answered based on filtered role / Questions asked based on filtered role * 100 |
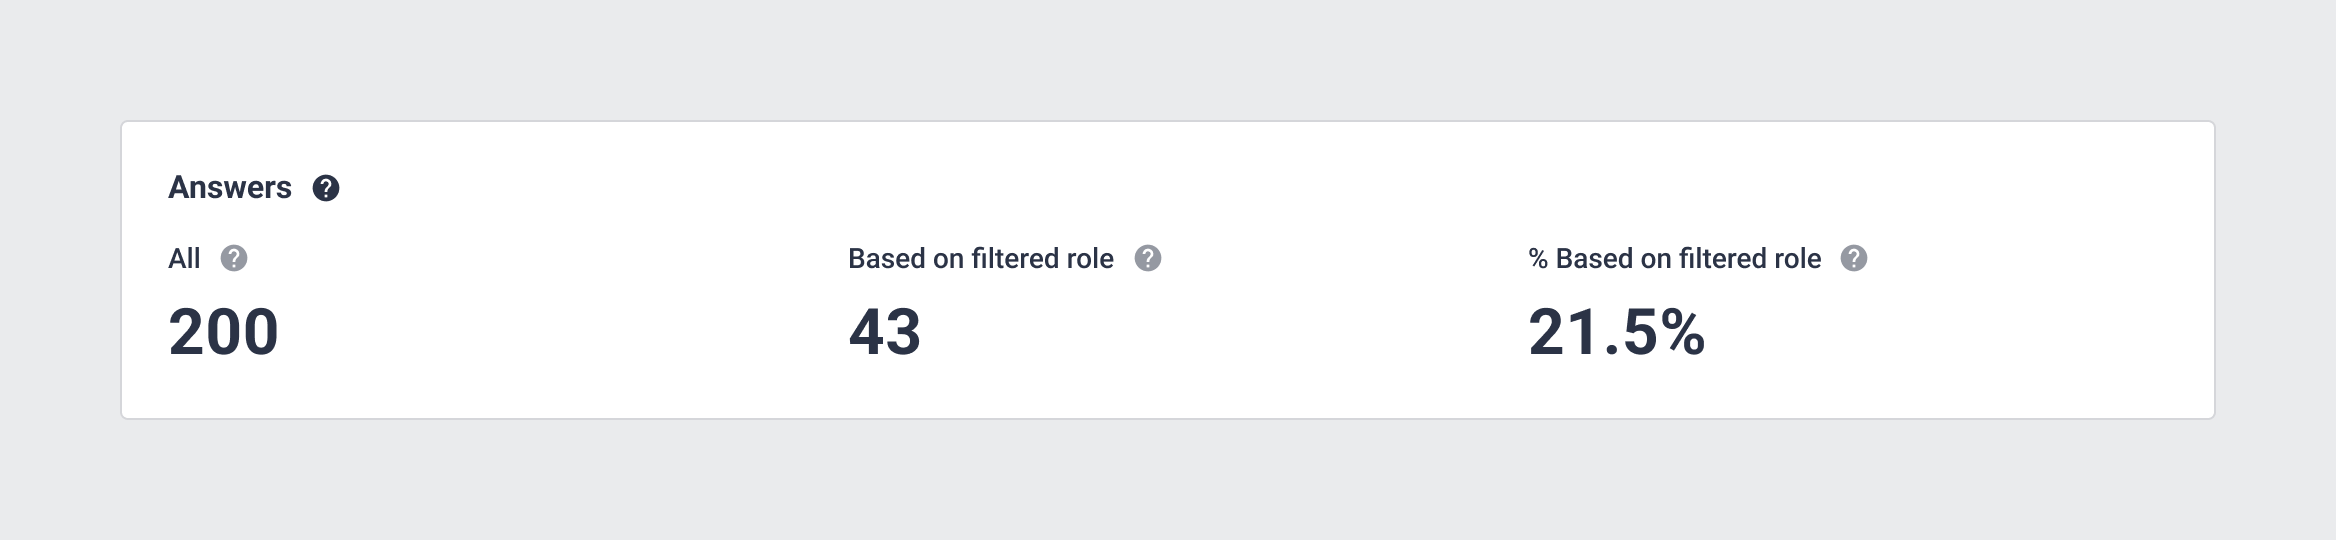
Answers
A different perspective is taken when we look at the answers. In this case, we look at when the answer was given, not when the question was asked. In this section, we will focus on the number of all answers that were given regardless of what the question was, or when the question was asked.
As we count only replies that were marked as best answers, it is important to define who we consider as the author of the best answer and how we track the date of posting the answer. In this dashboard, the author of the answer is the person who wrote the reply that was then marked as the best answer. We track the creation date of the reply, not the date when it was marked as the best answer.
| # All answers | # Answers Based on filtered role | % Answers Based on filtered role |
| The number of all answers given in a selected time period | The number of answers given by the users with a specific role selected in the User role answer filter in a selected time period. | Percentage of answers given by the selected users (User role answer) among all answers given in a selected time period. Formula: Answers based on filtered role / All answers * 100 |
Avg. answer time
Since the author of the answer is the person who wrote the reply that was then marked as the best answer, then the average response time shows the average time between the creation of the question and creation of the reply. This section does not track the time when the reply was marked as best answer. The time filter applies to the question creation time.
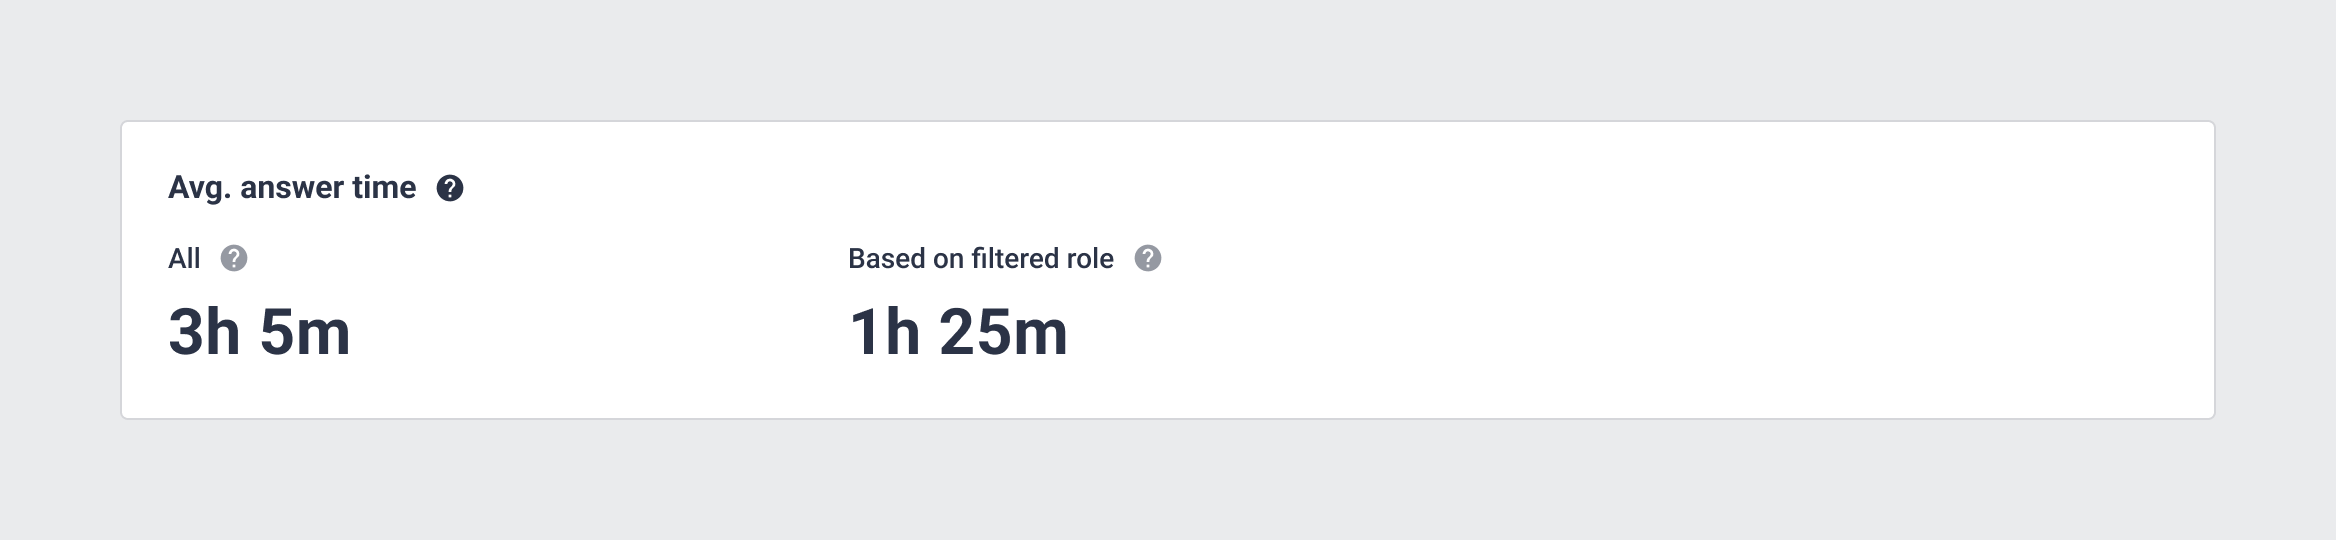
| # Avg. answer time | # Avg. answer time Based on filtered role |
| The average amount of time between creating a question and creating the reply that was then marked as the best answer. | The average amount of time between creating a question and creating the reply by the user with the selected role (User role answer) that was then marked as the best answer. |
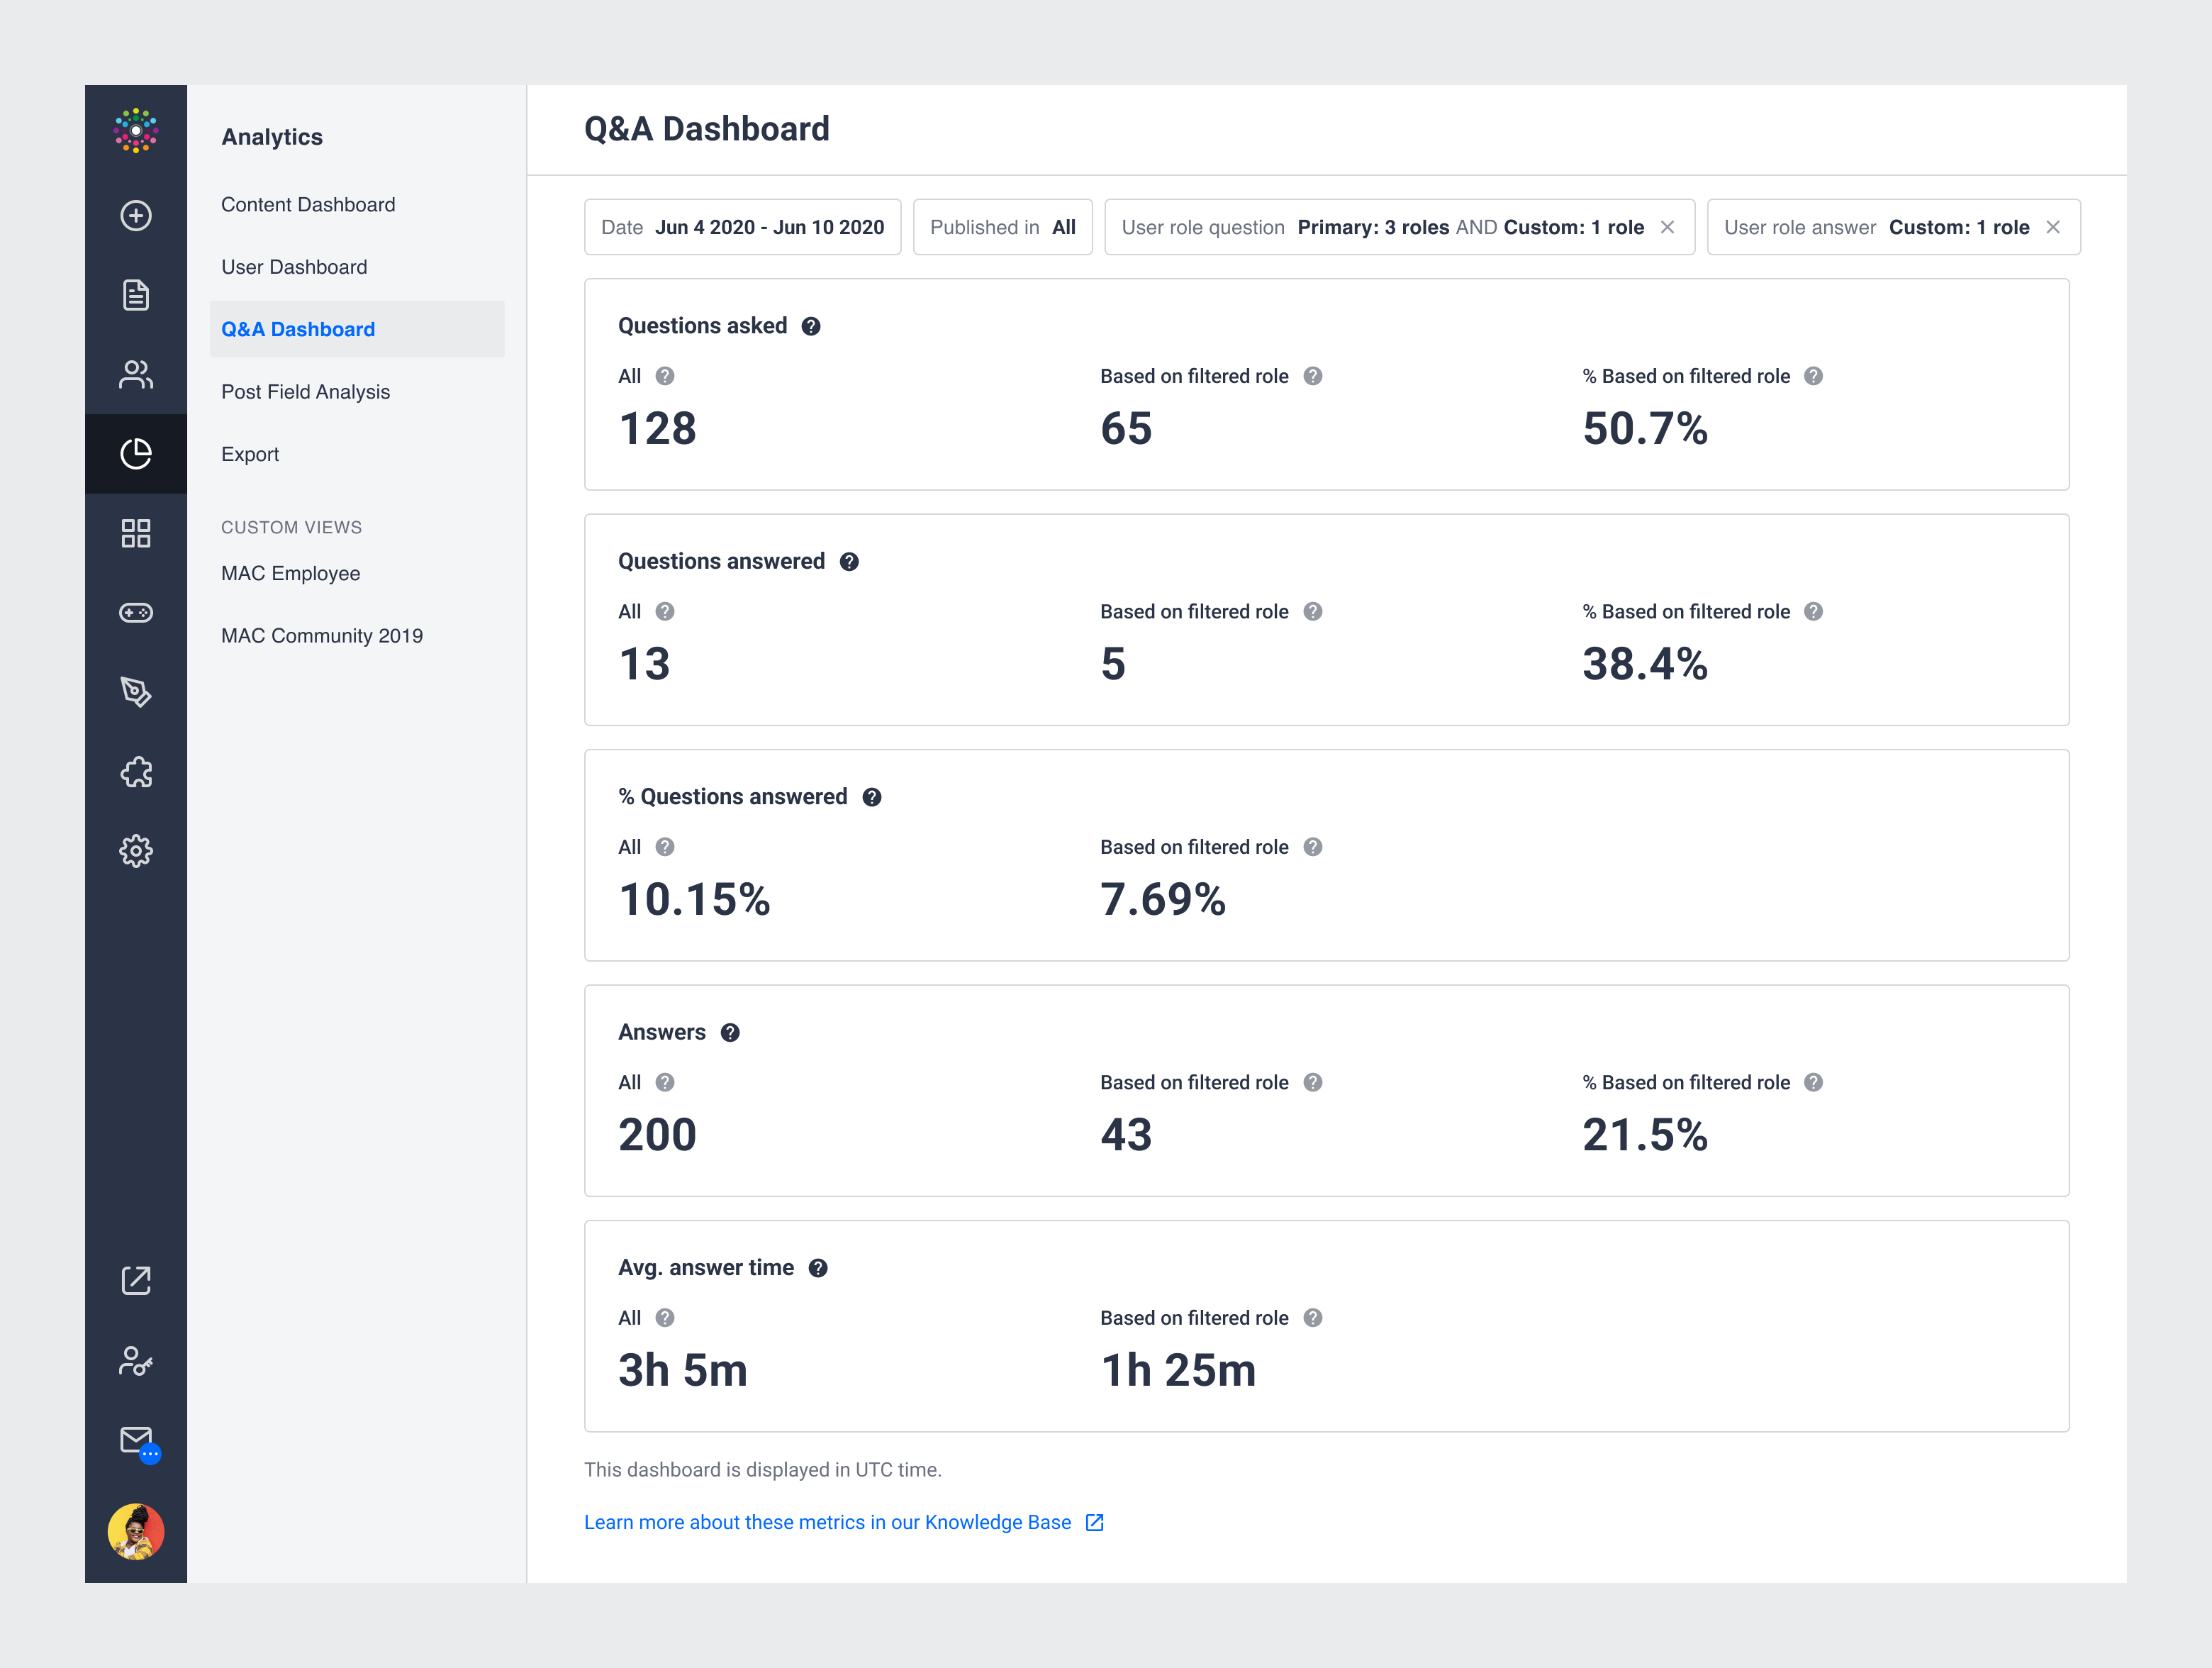
Q&A Dashboard Filtering Capabilities:
All KPIs can be filtered using the following filters:
-
Date - this allows you to filter by date to only show data from a selected time range
Note: Note: to apply a custom range, type your dates in the textbox and confirm by hitting the ENTER key before clicking the Apply button.
-
Published In - this allows you to filter by content categories
-
User role question - this allows you to filter questions asked in your Q&A module by user roles. This provides the ability to apply filters to the authors of the questions.
- User role answer - this allows you to filter answers given in your Q&A module by user roles. This provides the ability to apply filters to the authors of the answers
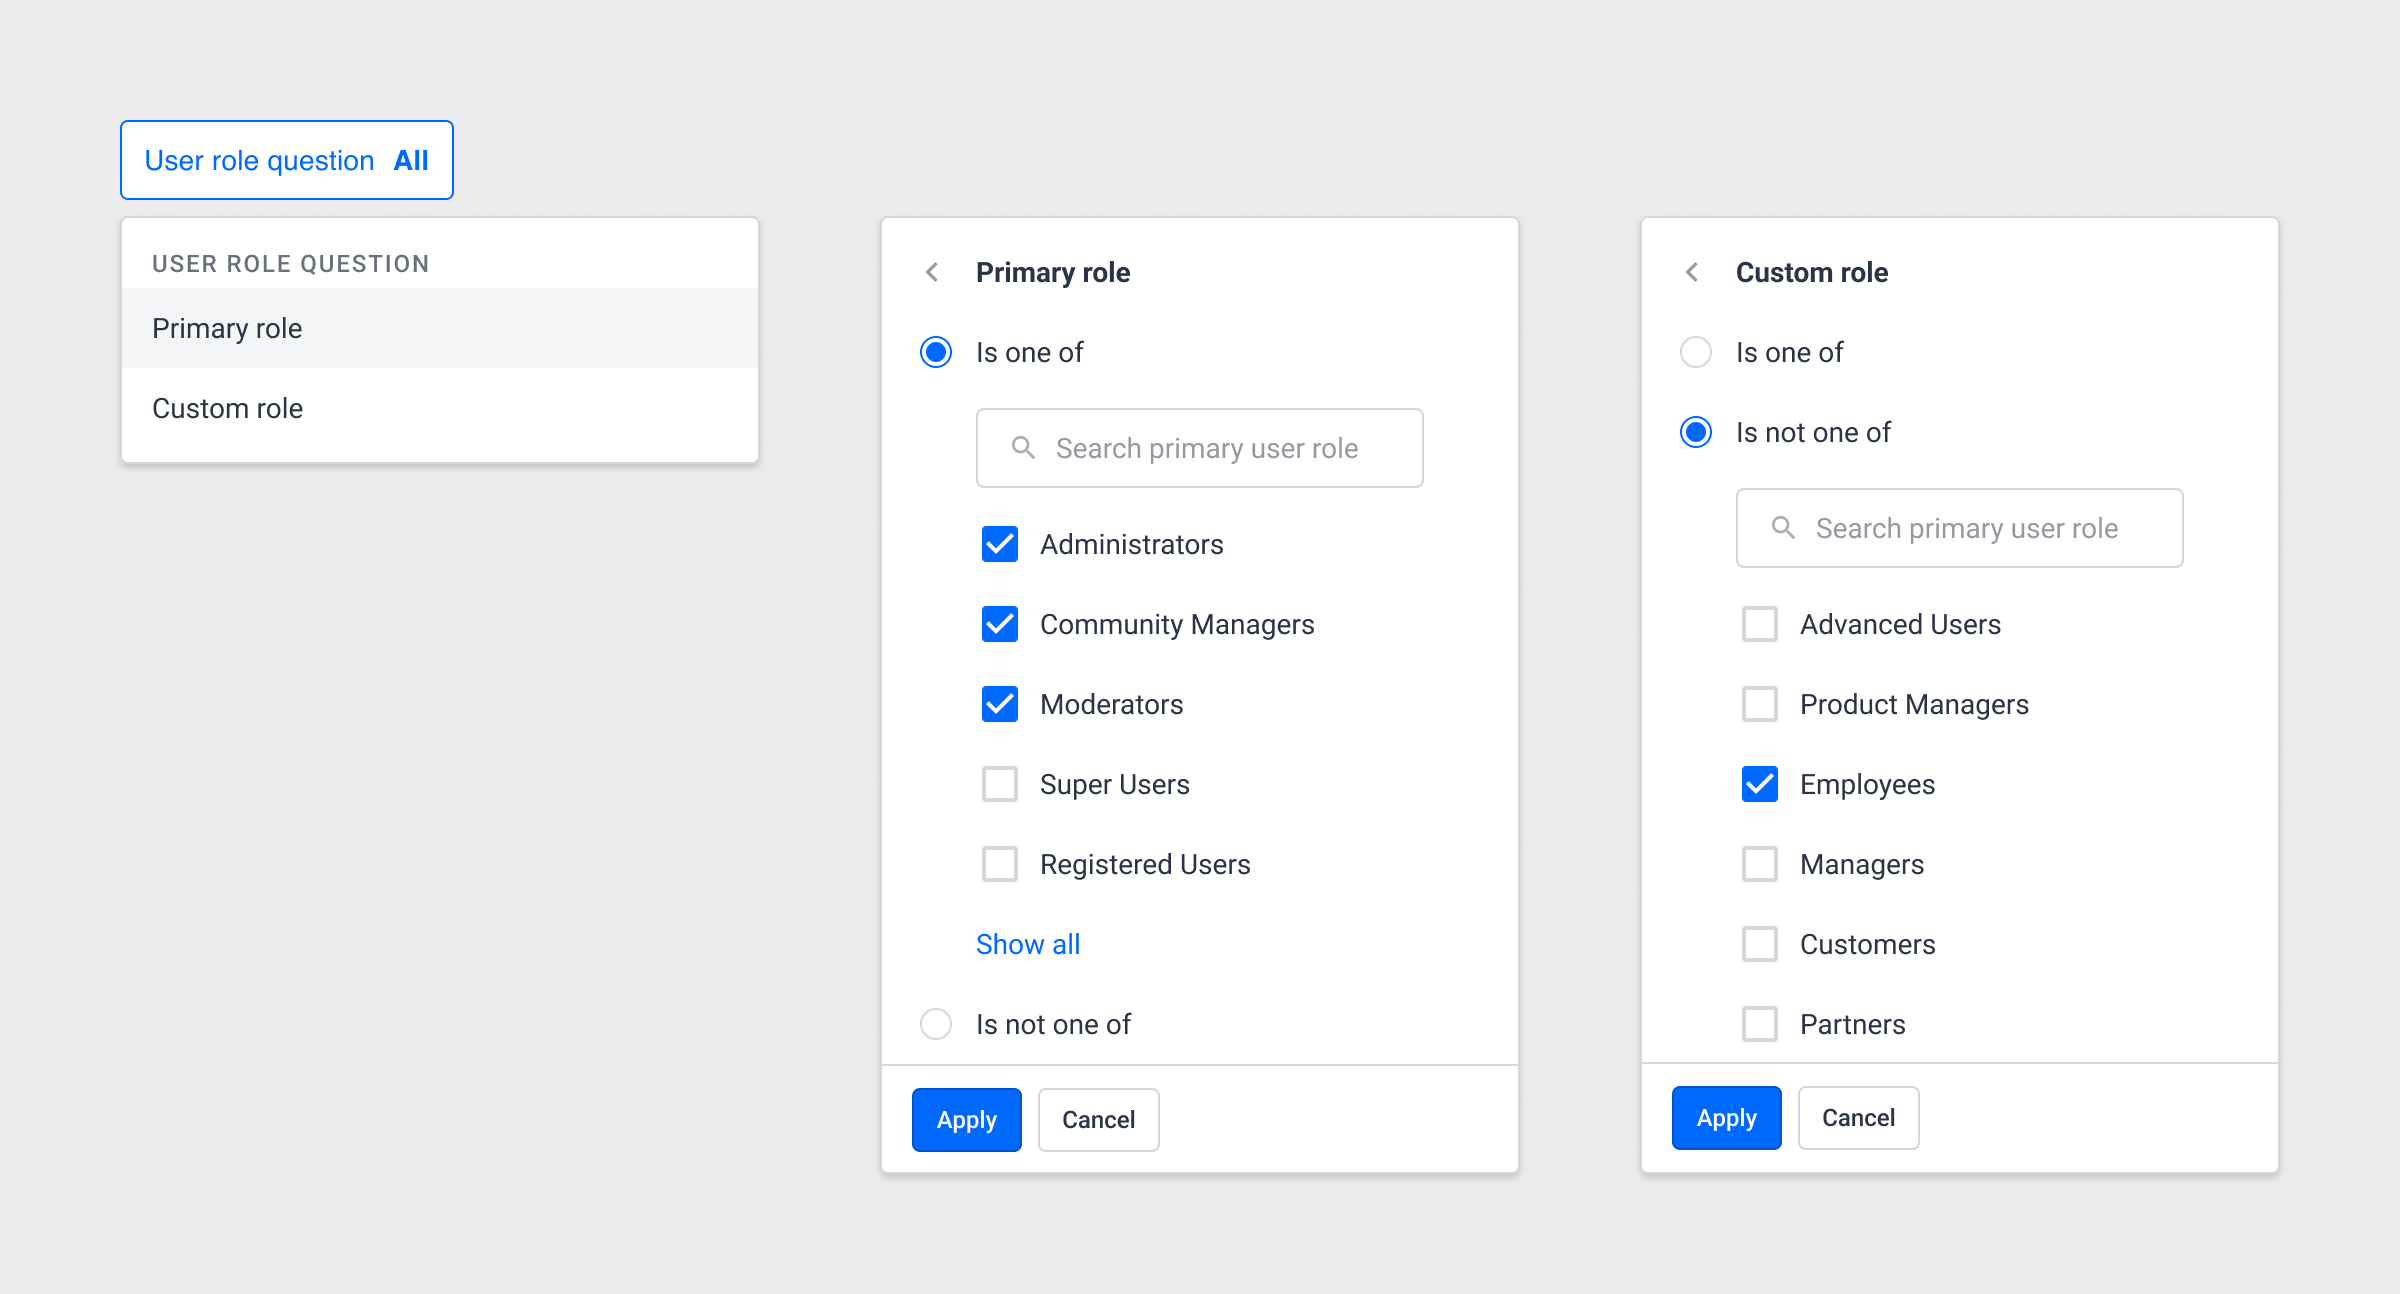
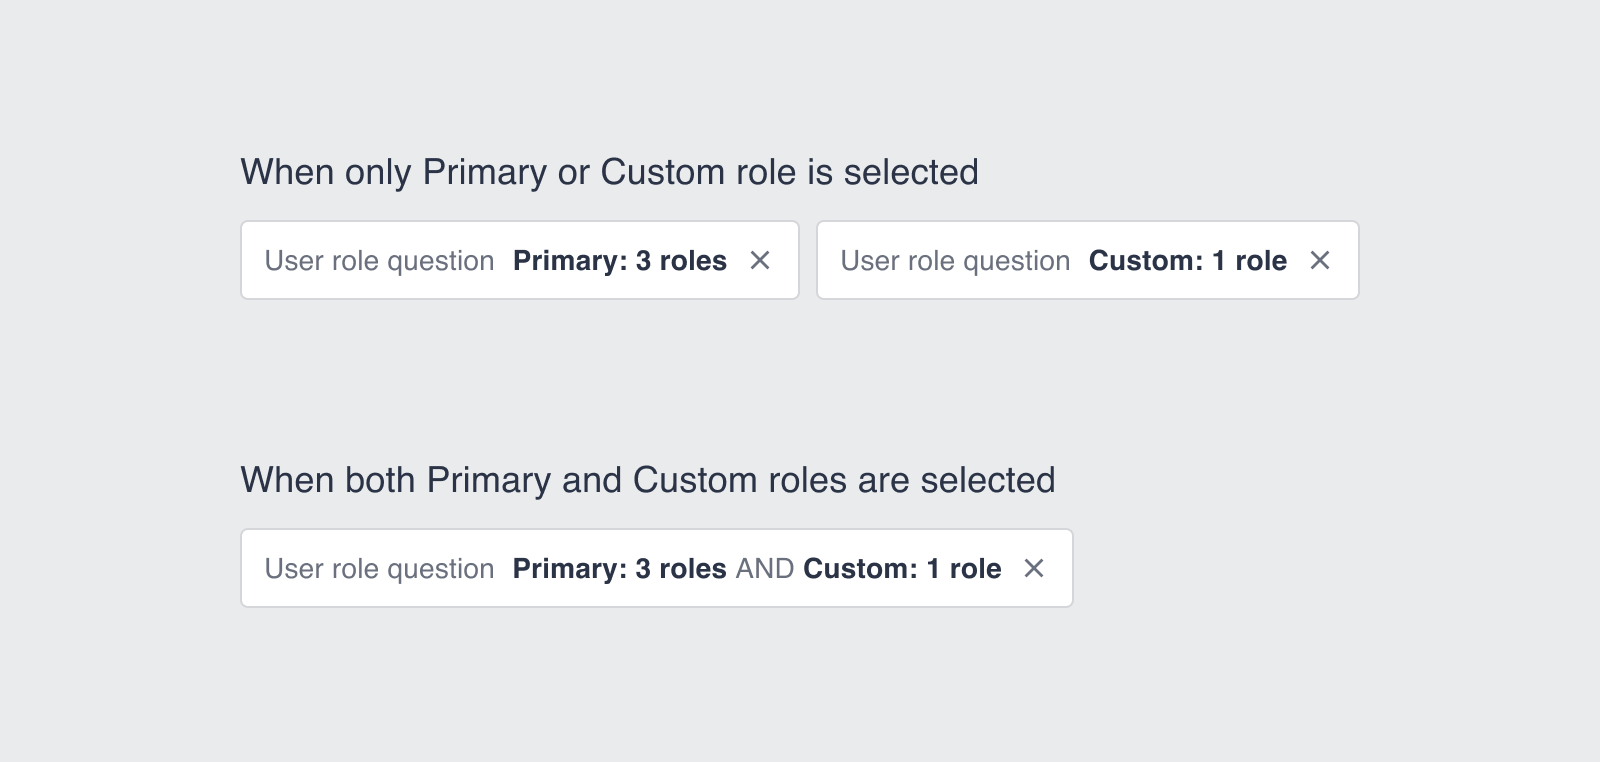
Each of the user role filters includes two separate filters on the Primary role and on the Custom role with the AND logic between them applied.
This means that if you don't select a Primary role and you choose one custom role, you will only see results for users who have this one selected role assigned. If you choose one Primary role and one custom role, you will see results for users who have both the selected Primary role AND the selected Custom role assigned.
If you select multiple custom roles, an OR logic will be applied. For example, if you do not select a Primary role and choose three custom roles, you will see results for users who have at least one of these three roles assigned. If you chose one Primary role and two custom roles, you will see results for those users who have the selected Primary role assigned AND at least one of the two custom roles.
Inside each of the user role filters, there are two options:
-
Is one of
-
Is not one of
So now you can exclude users with given primary and/or custom roles.
This added level of filtering capabilities allows users to take a more granular look at their data. For example, you can now see how many particular users answered a question asked by a specified group. To accomplish this, you would use both the User role answer filter and the User role question filter at the same time. If instead, you want to look at the authors of a question without excluding any authors of the answers, you should only use the User role question filter. If you only want to see answers given by users with selected roles, to all questions asked, you should only use the User role answer filter
To see how new questions and answers posted in the community in time will be seen in the Dashboard please have a look at this visualization
https://miro.com/app/board/uXjVP4EUfuQ=/?share_link_id=275177383512
If you have any questions about the functionality of the new Q&A Dashboard, please leave a comment below.