


It cannot be said often enough: Google  community!
Your community is not just another blog or marketing page. It is a trusted source of relevant, user-generated content. We as inSided continously update your platform (check below for the most recent changes) to make sure that the “findability” of content from your community is as good as possible.
This does not mean you can sit back and watch the organic traffic come in. Well, actually you can, but your manager might not appreciate that.  It is always recommended to be on top of you analytics to identify trends and counter them, should they damage your overall community performance.
Our guide will help you to enter the wonderful and sometimes confusing world of Google Analytics and Google Search Console. After reading it, you hopefully will have a better idea where to find those killer numbers to impress your colleagues with the performance of your community. Should you not have access to Google Analytics or Search Console, or should you not have access rights to certain pages covered here, reach out to your colleague who is managing these accounts to get yourself access to it.
Google Analytics
Google Analytics surely is a complex tool where it is easy to get lost in. Let’s start with the most important pages and KPIs to look at before we head into the SEO-specific things. While in Google Analytics, you will find the most basic (but important) information within the following pages:
Audience - Overview
This page does include a lot of information, such as the bounce rate (% of people who leave after viewing a single page - which is not necessarily bad, if the content does the job). However, to keep it simple, the list below should be the foundation of your general reporting:
- session
- users
- pageviews
- pages per session
Ideally, the sessions should see a steady increase, as newly added content attracts new visitors via organic search. Same goes for the amount of users. Simply switch to this graph in the top-left corner of the overview. You will then see how many users are visiting your community each day/week/month, but even more important, how big the share of new visitors is:
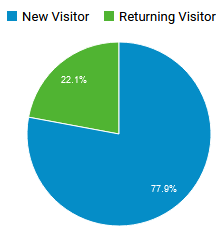
Compare this KPI with a previous period to see if the returning visitor share is growing (a good indication of community success). This is important not just as a general indicator of community growth, it also indirectly shows how many users are re-visiting the community based on good SEO.
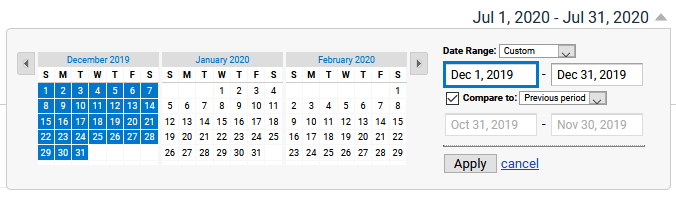
Tip: You can easily compare year-on-year performance in the same view by selecting “compare to” in the date picker.
Acquisition - overview
On this page, you will find crucial information about the general SEO performance. Check the percentage of organic traffic, it should also be growing over time. However, this share is affected by e.g. how many links you place on your homepage or within your product: adding links to all FAQs will result in an increase of referral traffic, which will lower the organic traffic share. Below you can find the average organic traffic for communities, divided by community age:
| Maturity | Average % organic traffic |
|---|---|
| 0-2 years | 55% |
| 3-5 years | 75% |
| 6-10 years | 85% |
Tip: Hover over the pie chart to see the total amount of sessions, then compare this with a previous period. It will tell you more about the real growth in sessions, not just the overall % share of traffic.
Community search
If you have activated search console for your Google Analytics, you can also see a bit of information about which Queries are responsible for most of the organic traffic. Should you not have enabled this yet, the page will give you a quick guide on how to do this.
In the table you will see how many users have performed a search, and how many users actually clicked on a result pointing towards your community. Watch the most popular search queries and check for trends - also if some pieces of content are not making it into the list. You can find this view under [Acquisition] - [Queries].
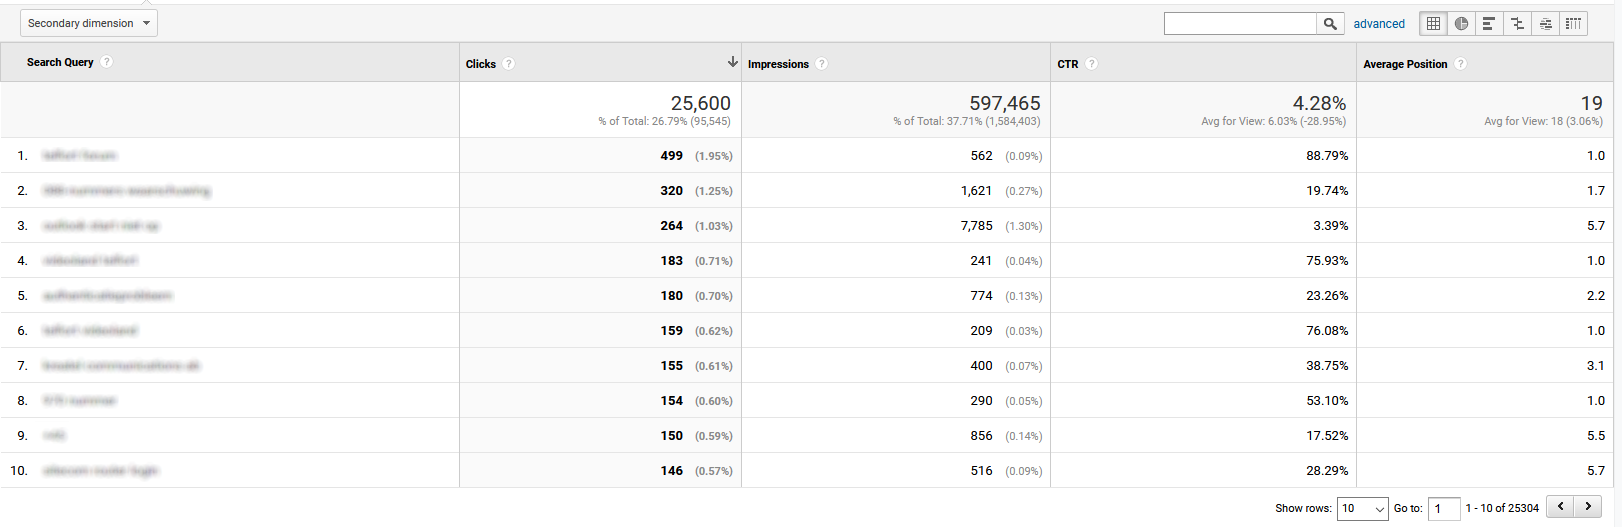
Tip: Create an export (top right corner) and analyze which content is worth improving (e.g. high impressions but a low click rate).
Site search
This metric is not directly related to SEO in the traditional sense. But it’s good to point out that you can also check the most popular search queries within the search function on your community. You can find it under [Behaviour] - [Site Search] - [Overview]. This page however only is working after you have added Google site search to your community. Check this topic to learn how to do it:
Google Search Console
The name says it already, this site offers you a 360 degree overview of the SEO power of your community. You will find a lot of information on various aspects, these are the most important things which you should be focussing on:
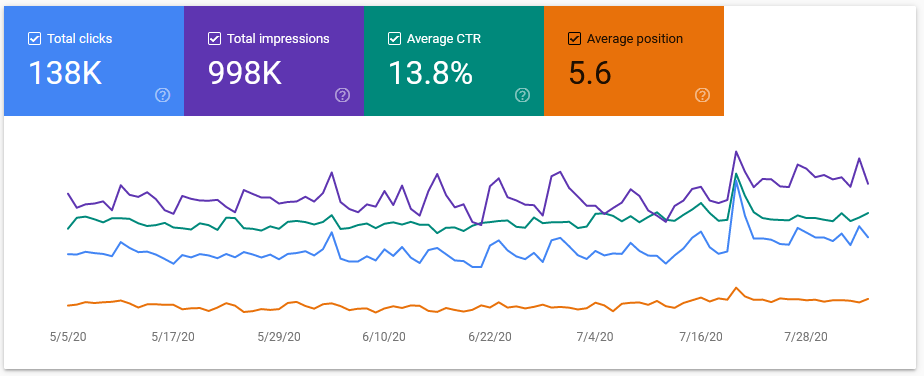
Performance
On this page, you will find the most important SEO KPIs:
- The total amount of clicks your community has received in the selected timespan
- The total amount of impressions: How many links to the community have been viewed by users
- The average click-through-rate, so the % of impressions that resulted in a click
- The average position tells you on which spot in the search results the community usually scores
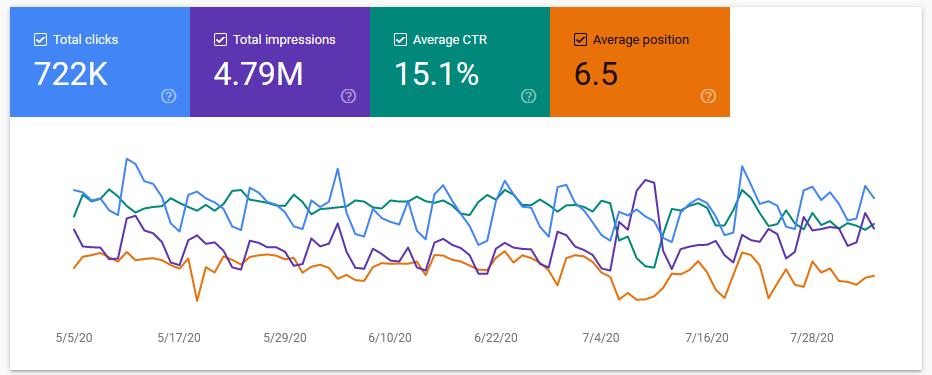
Tip: Archiving old content, as well as adding a robots.txt file to your community will help you improving on the average position and click-through-rate.
If you click your way through the tabs, you will see your top performing queries and pages:
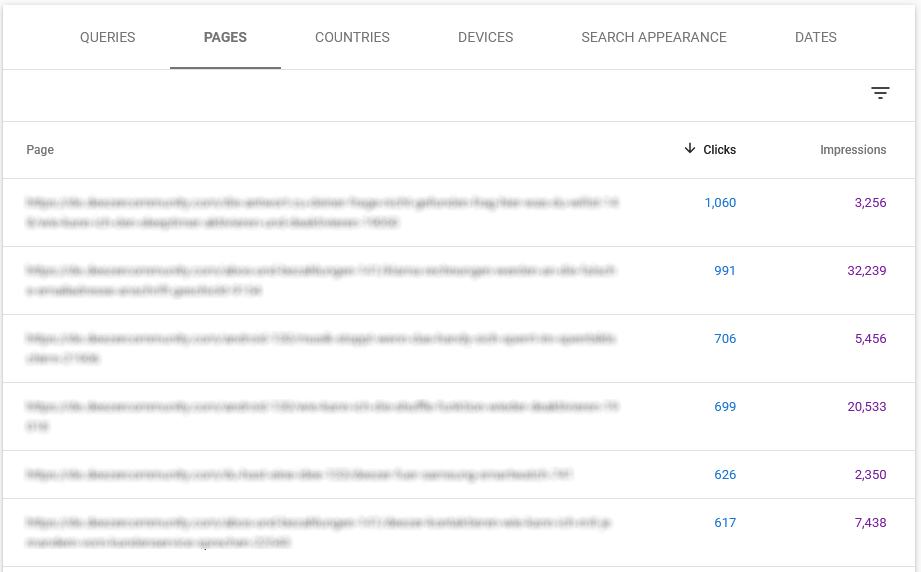
Use this information to optimize the top-performing content. It could be that you find that outdated content has build up significant SEO value, however another topic will help much better. Add a link to your preferred content to guide your users in this case. You could also update the topic in case it has been created by the community team.
Initiatives like these will help you to increase the average position (and in consequence the click-throug-rate), as Google recognizes the user does not come back after he/she found the right information.
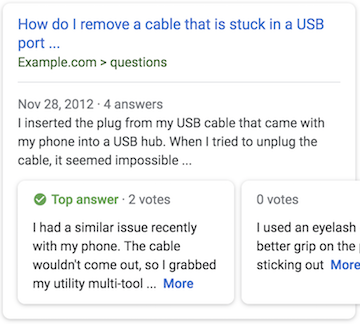
Google rich results
Due to an improvement in the inSided platform, Google can understand what the valid answer to a question is. This means that all answered questions can get a prominent spot in the search results, deflecting questions even outside of the community.
Within Search Console, you will find the performance of these rich results under [Enhancements] - [Q&A]:
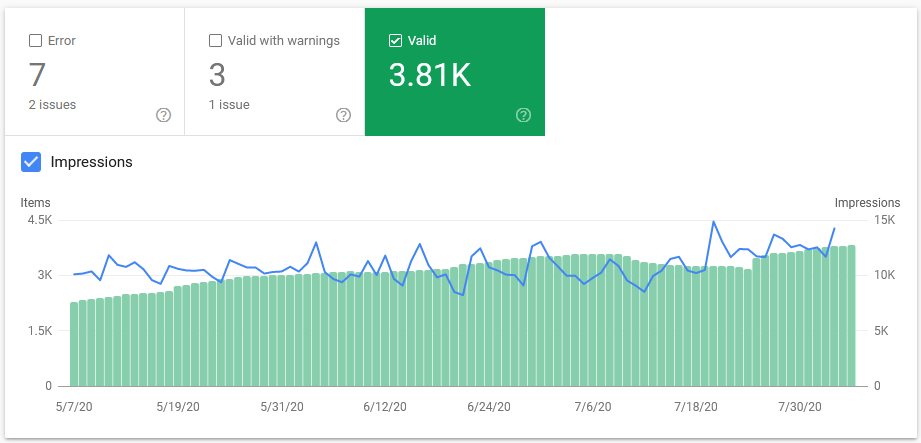
By using the [Performance] page described above, you can even find out more aobut the performance. Simply click on [Search Appearance] and select [Q&A rich results] afterwards. You will then see the general SEO performance of these rich results.
It will be valuable to know about the impressions on rich results, as it is additional deflection the community is responsible for. Unfortunately it cannot be quantified how many users actually found the answer to their question this way, you can surely argue that this is having a positive impact on reach and deflection.
We hope that you have learned a bit about the jungle that SEO sometimes can be, and that you are now able to get your reporting to the next level. Anything you want to know more about? Still lost? Just let us know in the comments.  Here an article which might be interesting for you to continue:
