


A topic that we often discuss with our customers is how to track the impact and value that a community is delivering. This is not just relevant to learn about the return of investment, but also is important for internal recognition: A Community Manager should be able to explain to anyone in the company in one sentence (or metric) what value the community brings. Here we discuss a number of best practices as well as emerging trends in measuring the service value of your community.
Deflection estimates & exit surveys
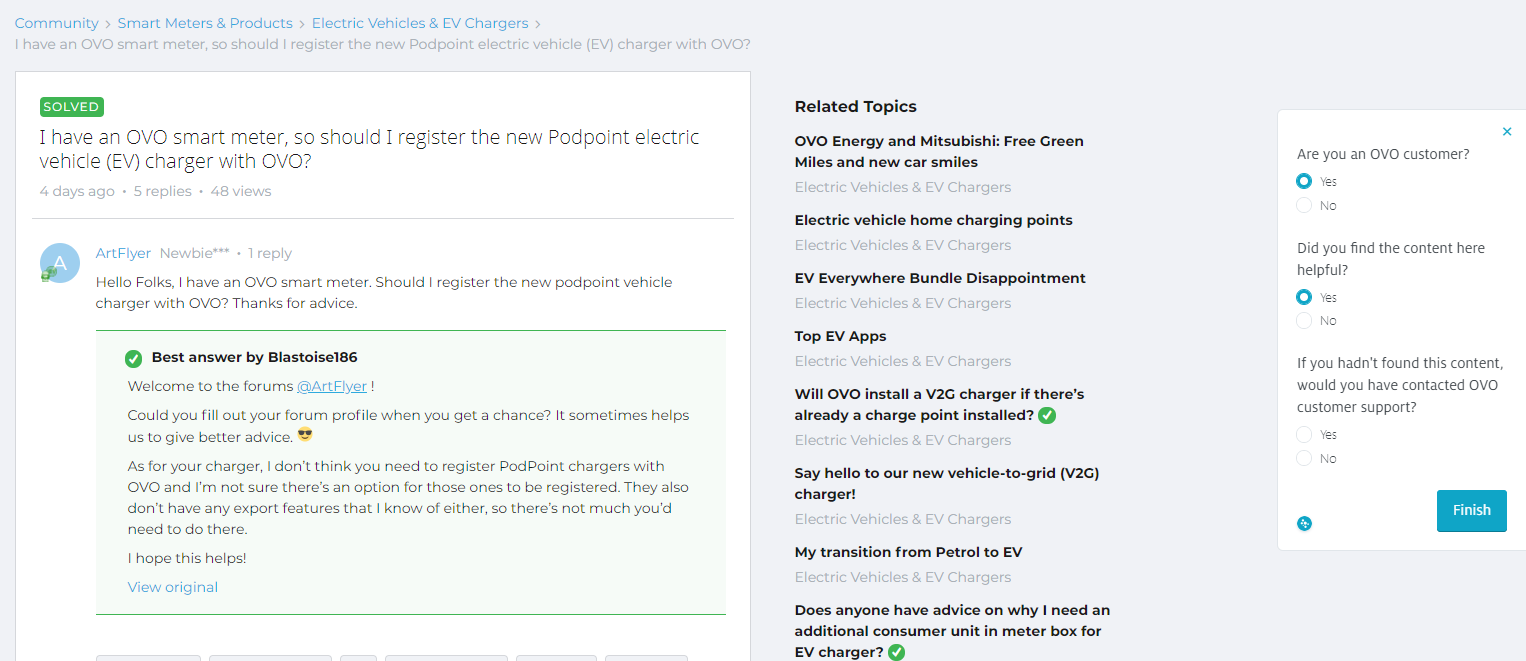
Within most service-oriented communities, value has traditionally been measured with a ‘deflection estimate’ driven by the output of an exit survey. There isn’t just one way to do a survey like this, but in general most exit surveys ask:
- Did you come to the community looking for information?
- Did you find what you were looking for?
- Would you have contacted customer support otherwise?
With this data we can estimate the amount of total visitors that found their answer and that would have otherwise contacted via another channel. Here is an example:
| % looking for information | 86 |
|---|---|
| % finding the answer | 32 |
| % would have called | 51 |
| % of visitors deflected | 14 |
| # of visitors / month | 100.000 |
| Contacts deflected | 14035 |
This is a powerful metric in itself, but when used alone it has one downside - we’re looking at the community in isolation rather than as part of a broader landscape. It doesn’t tell us how this number relates to the actual volumes on other channels.
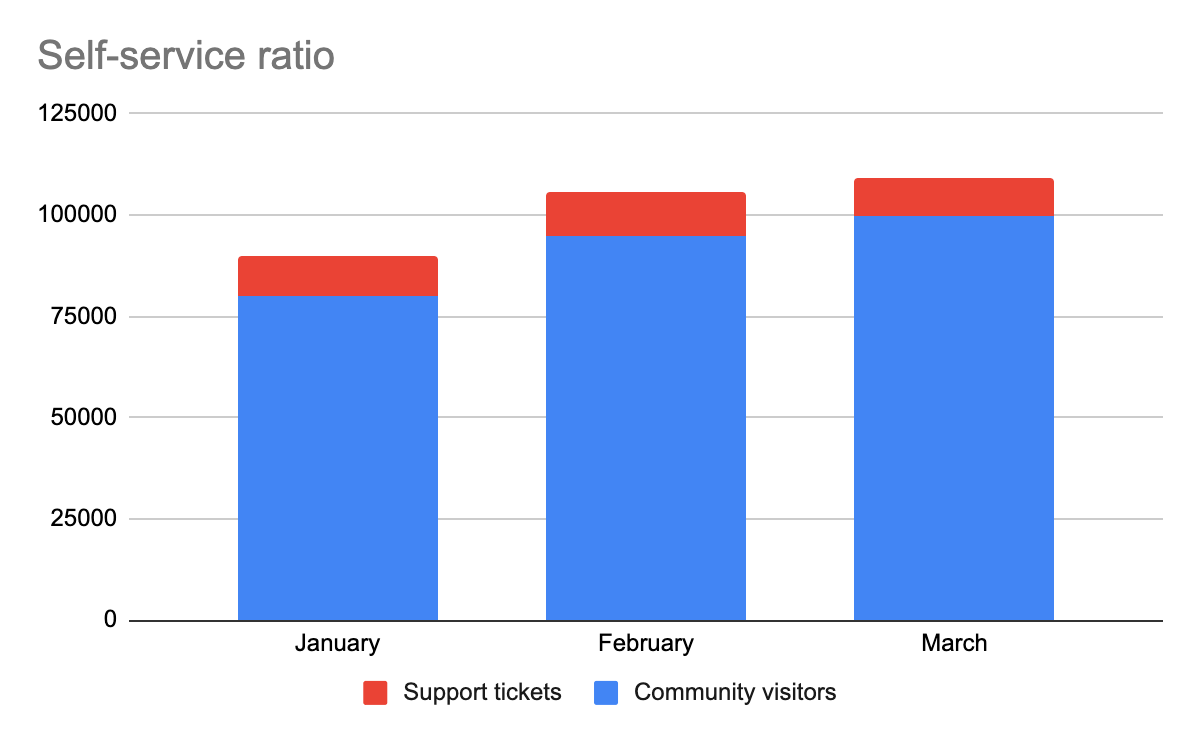
Generating a self-service ratio
A few years ago I started to add a new metric into my top-level reporting. I wanted to see how the volumes of visitors coming to the community for help and advice were evolving in relation to other channels. So I began to track the number of visitors to the community and compared them to the number of tickets on support channels like phone and email. By tracking this proportion you get a new perspective on shifts across channels over time. You might, for example, discover that visitors to the community are growing faster than support tickets as the community grows and organically produces content that answers more questions. You might also discover that the community absorbs peak volumes when used as a 1-to-many communication channel during your busiest periods.
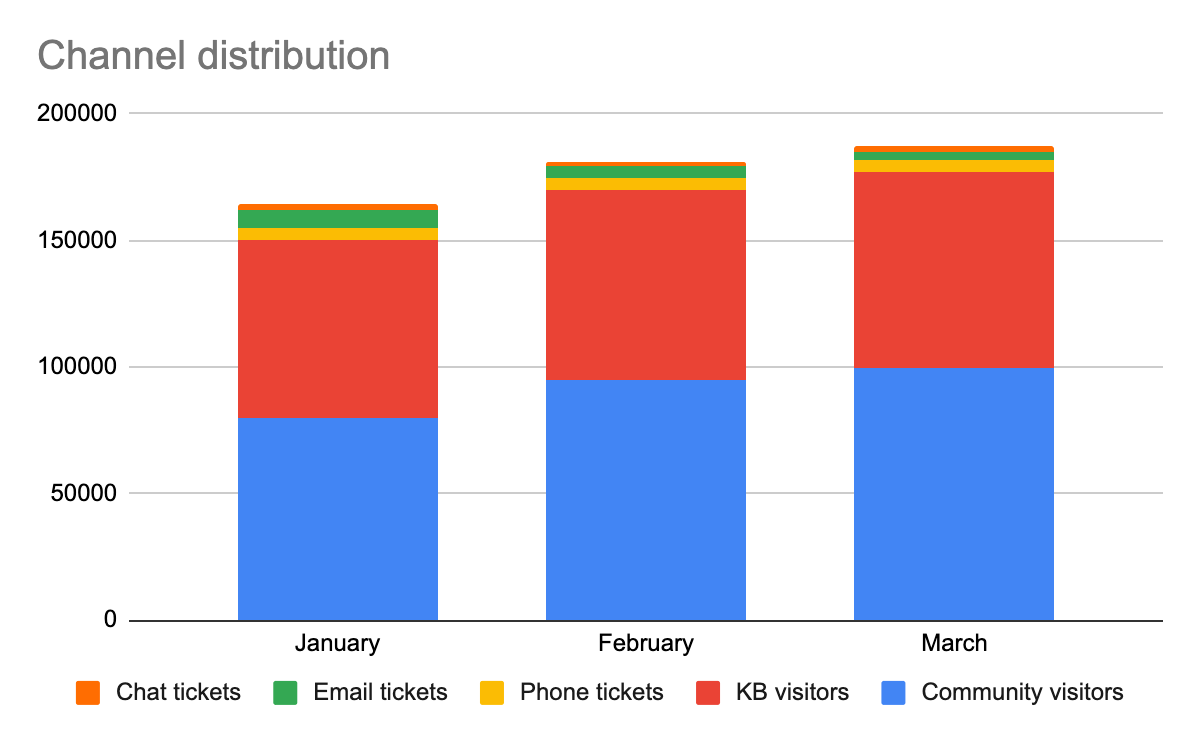
Comparing channel distribution
To take this view to another level you can build a channel distribution view that splits out all digital and transactional volumes by channel. You could include visitors to the knowledge articles on the support site, for example. Here you may discover that volumes on channels like email start to decrease as the community grows over time. Or that no matter what happens on other channels, that a proportion of your customers are always going to phone.
Combining exit survey and self-service ratio in a channel overview
One other way that you could build a view like this is to combine the insights from your exit survey and only take the estimated ‘deflections’ into your self-service ratio or channel distribution view for the community. This gives you a more conservative view but shouldn’t impact the trend you see over time.
We’d love to hear from you
How do you look at the impact your community is having from a service perspective? Do you also work with a self-service ratio or channel distribution view? What works best in your organisation?
